Thursday, September 1, 2011

Fronting your Stratos service with the WSO2 LoadBalancer

Today I wanted to front the StratosLive Manager with the WSO2 LoadBalancer. I didn't have an idea on how to do it. Then with Afkham Azeez's instructions, I was able to do it. I thought of recording the steps for my and others future use. Following instructions will guide you to front any stratos service with a loadbalancer.

First you need to have the WSO2 LoadBalancer and the service (in this case WSO2 Stratos Manager).

Changes to be done in LoadBalancer
Find the loadbalancer.xml in the repository/conf folder.
Add the following lines under services tag.


cloud-test.wso2.com

wso2.manager.domain


This host name is important because it is going to be added to the axis2.xml of Manager.

Add the above host name to /etc/hosts file.

Changes to axis2.xml of Manager
First enable clustering .


Then set membership scheme to well known addressing - wka


wka

Then set the domain as wso2.manager.domain. This is the host name added in the loadbalancer.xml.


wso2.manager.domain

Change the local member port to some random value, say 5000.


5000


After setting the above parameters, start the LoadBalancer. Then start the Manager. When the manager joins the cluster, you will see a log similar to the following in the LoadBalancer log.


[2011-09-01 23:55:55,919] INFO - RpcMembershipRequestHandler Received JOIN message from 192.168.1.2:5000(wso2.manager.domain)
[2011-09-01 23:55:55,921] INFO - MembershipManager Application member 192.168.1.2:5000(wso2.manager.domain) joined group wso2.manager.domain
[2011-09-01 23:56:06,935] INFO - DefaultGroupManagementAgent Application member Host:192.168.1.2, Port: 5000, HTTP:9763, HTTPS:9443, ACTIVE:true joined application cluster


Now you can try to access Manager's management console via the following url https://cloud-test.wso2.com:8243/

Note that Manager is running on 9443. But we specify the port as 8243 because it is the port LoadBalancer is running. Then, the above request first goes to the LoadBalancer and then to the Manager. When you enter the above url in the browser, you can see this by monitoring the two logs of LoadBalancer and Manager.

NOTE: This is the most simplest scenario fronting a service with the load balancer.

Thursday, August 25, 2011

Billing in cloud computing - StratosLive billing explained

StratosLive comes with its own billing system to bill the tenants for using the cloud. Lets have a look at the bill generation process of StratosLive. Shown below is a simple diagram to explain the base entities involved in bill generation.

There can be multiple billing engines in your environment. In StratosLive there are two of them. One is for scheduled bill generation (monthly invoice) and the other is for on-demand bill generation (interim invoice). Both these engines use a single billing database. Each of these engines have a set of handlers to be executed. These handlers can be configured via the billing-config.xml. These handlers are executed by the engine at the time of bill generation. Shown below is segment from the billing-config.xml


multitenancy-billing-rules.drl


email-billing-notifications.xml


What are the data used in bill generation?

  • Subscription details – subscriptions of the user for the duration considered in the bill generation. There is a subscription entry for each usage plan which the user was subscribed to during the billing period
  • Usage details – Usage details of the user for the month of bill generation. This includes bandwidth usage (webapp bandwidth, service bandwidth and registry bandwidth) and registry storage of the user.
  • Pricing strategy – This defines how users are going to be charged for subscription and overusage. Shown below is a sample xml file which defines the pricing strategy.


10

10
0


25
0.1


2000
0.1


When does bill generation happen?

As I mentioned previously, monthly invoice is generated by a scheduled task. This is achieved via Synapse scheduled tasks. When the billing manager is started (i.e. when the server starts), bill generation task is scheduled for the billing engine. This task scheduling can be configured via the billing-config.xml.

Lets go through the bill generation step-by-step. Billing engine for scheduled bill generation executes the following set of handlers.

1.SubscriptionFeedingHandler – Retrieves the subscription entries relevant to the bill generation period. For each subscription, relevant user's usage data also retrieved. Subscription entries are added to the BillingEngineContext to be used by other handlers.

2.SubscriptionTreeBuildingHandler – Goes through all the subscription in the context and arrange the subscriptions of same customer together. Creates invoices and assigns the subscriptions to them. Fills some data of the invoice such as invoice dates, payments falling under the billing period.

3.RuleHandler – Rules are used to calculate the subscription fees. Rule handler executes the rules over the billing engine context. This will assign a subscription fee for all the subscriptions in the contex.

4.InvoiceCalculationHandler – Over usage charges are calculated by this handler according to the pricing strategy define in a xml file. Total cost, total payments an carried forward values are also calculated. At this moment, there is a complete invoice for all the customers in the memory.

5.Finalizing Handler – This handler takes care of storing the invoices in the billing database.

6.EmailSendingHandler - After generating and storing the invoices, customers have to be notified. It is done by the email sending handler. When this is done you receive an email notifying you about the invoice.

Diagram below gives an idea on what happens in the first four handlers.


Scheduled vs. On-demand bill generation

These two operations are carried out by two billing engines

Scheduled generation executes two additional handlers than the on-demand generation. They are the finalizing handler and the email sending handler. When the invoice is generated on-demand, it is not stored in the database (because it is only for presenting to the user). No email notification is necessary because the invoice shown in the UI. That is the reason for FinalizingHandler and EmailSendingHandler not needed for on-demand bill generation.

Flexibility

The whole bill generation process is execution of set of handlers. If you want to add something new to the flow, you can simply write a handler. Then you need to mention that handler in the billing-config.xml for it to be executed by the engine.

Billing component will be further improved to calculate all the costs via rules. Then it will be super easy to make changes in cost items and pricing because only what we need is to edit the rule file. This avoids any code level change when it comes to changes in calculating the cost which is a huge advantage.

Wednesday, August 24, 2011

Billing the cloud - StratosLive invoice - What does it contain?

StratosLive is a complete Open PaaS from WSO2. It comes up with its own billing component to bill the tenants for using the cloud. If you have tried out StratosLive, you must have received a monthly invoice for using it. Although you receive an invoice it does not means StratosLive charges for everything. If you want you can sign up for a Demo account which is free or else you can sign up for a paid account with more privileges to consume resources.

StratosLive's billing is based on two parameters.

1.Subscription of the tenant – When you sign up to use StratosLive you can select a usage plan. You can change this usage plan whenever needed. There is a monthly subscription fee associated with the plans.

2.Resource usage – When you select a usage plan, there is a set of resources which can be used under that plan. If you happen to consume resources more than the amount allowed, the excess usage will be charged.

Invoice is generated on the last day of the month and you are notified via email once it is available. Shown below is a sample invoice and I'll describe what is included in it. You can view the invoice in StratosLive Manager's Home → Billing & Metering → Past Invoices.

Following information is available in the invoice.

A) Invoice number

B) Invoice period (i.e. for which time period does this invoice applicable) and Invoice date – date which the invoice was generated

C) Subscription fees for the subscriptions you have used during the period. For example if you have sticked to the same subscription there will be one entry for this. But in this sample invoice, the user has used a SMB usage plan for 5 days and then has changed it to a Demo usage plan. Therefore there are two entries for subscription fee section. It is important to notice that the subscription fee is calculated only for the number of days which you were subscribed in to it.

D) Over usage charges – At the time of bill generation, users usage data is retrieved by the billing engine and compares it with the allowed usage limits for the active subscription at that time. If the user has exceeded the allowed limit, excess usage is charged. Charging the excess usage depends on the desire of the cloud owner. For example, in the above invoice, the tenant has consumed 32MB of excess storage. But it is not being charged. Over use charges are calculated for Bandwidth and Storage. Invoice clearly mentions how much is charged for each of them.

E) Payment details within the period – If you did a payment for your previous invoice, it should clearly be mentioned in this invoice. You can see it in the sample invoice too.

F) Finally, there is a summary which includes the Brought Forward value, Total cost for this period, Total payments during this period and the Carried forward value.

G) After all those details, you get the Paypal button to pay the invoice securely.


Interim Invoice

You will not find this facility in many billing systems. But StratosLive provides you to view your cost for using it up to this moment. Interim invoice shows your costs from the last invoice date to this moment. Many cloud services only provides you the monthly invoice at the end of the month. But we provide you the invoice on demand.

If you have been charged for over using resources, you can check whether the excess usage amounts mentioned in the invoice are accurate by going through you usage report for the month. Usage report can be found at Home →Billing & Metering →Usage Report

Tuesday, August 23, 2011

Throttling in a cloud environment

What is throttling?
The word "throttling" simply means "controlling" when it comes to the computing world. Throttling can be seen in action in different situations. For example,
  • On a LAN, the network admin may throttle the bandwidth to control network congestion and server crashes.
  • An ISP may throttle the bandwidth for some users to control their usage above a certain limit.
  • CPU throttling is used to conserve power or reduce the heat generation.
Why throttling is important in cloud computing?
When hosting a cloud, you have to be aware of the multi-tenant aspect which can cause problems in consuming cloud resources. A large number of users may using the cloud environment in different ways. If your cloud is a PaaS, they'll be hosting services or web applications. If it is SaaS, they'll be using your software. If it is an IaaS, they'll be running VM instances in your platform.

In any of the above scenarios, if a user is consuming too much of your resources, it can cause problems to your entire cloud environment. Either you have to control the user's behaviour or you have to scale up your resources to cater the situation and then charge the user for consuming resources. Even though you decide to scale up and charge, it is always to good to have a control mechanism.

Another advantage of throttling is, you can use it to support your billing system. For example, if you charge based on subscriptions and you want to restrict the users consuming resources not allowed by their subscription, then, throttling is the answer for you.

What can be throttled?
In a cloud environment, there are several parameters which can be throttled.
  • Network bandwidth
  • Storage
  • CPU usage
  • I/O operations
Lets see how throttling is used by a real cloud environment. I am considering StratosLive, a complete Open PaaS from WSO2 to describe how it is using throttling.

Throttling in StratosLive
StratosLive presents you the complete middleware platform Carbon from WSO2 in the cloud. Users can create tenants and use the StratosLive cloud environment. It uses throttling to makes sure the users only consume the resources which are allowed to them according to the usage plan they subscribe to. It throttles following parameters.
  • Webapp bandwidth - Tenants can host webapps in WSO2 Application Server. When requests are received and responses are sent, it is checked whether the tenant has permission to consume the bandwidth. If not, i.e. tenant has already consumed the allocated bandwidth, the request will be rejected.
  • Service bandwidth - Same as webapp bandwidth. This applies to the services hosted in StratosLive.
  • Registry bandwidth - This is considered when registry items are accessed by tenants. When a get/put operations is carried out in the registry, a certain bandwidth is consumed. It also undergoes throttling.
  • Registry storage - Tenants are allowed to store artifacts in the registry. But to control the storage consumed, it is throttled.
  • Number of users per tenant - When a tenant is created, tenant admin can add users to the tenant. This can be throttled if needed.
Above mentioned throttling is done based on monthly usage data of tenants. Not only that, there are throttling rules. These rules can be changed on the fly, making StratosLive's throttling capabilities very powerful.

You can read more about throttling in StratosLive from Sanjeewa Malalgoda's blog.

Monday, August 22, 2011

Metering, Throttling and Billing in cloud

Usage metering is a very important area when it comes to cloud computing. No matter whether it is a public or a private cloud, PaaS provider will be interested in metering the resources consumed by tenants. Accurate metering leads to successful throttling and billing.

WSO2 StratosLive is a public cloud deployment. There needs to be a way of measuring how tenants consume cloud resources. It is necessary to measure them to control or facilitate the tenants consuming resources. StratosLive encourages tenants to make full use of it's resources. But there needs to be a control mechanism too. Billing, Metering and Throttling components are responsible for measuring resource usage, charging the tenants and controlling access to resources in StratosLive.


What is Metering, Throttling and Billing?

Metering is the base for Billing and Throttling. It measures bandwidth and storage consumed by tenants. Throttling runs its throttling rules against the metered data and takes decisions on access controlling to resources. This resources are, webapps, services, registry storage and registry items. Billing, if enabled (which is enabled in StratosLive), charges customers based on the metered data in a monthly basis. Billing considers not only the metered data, but also the usage plan which the tenant is subscribed and the pricing strategy.


Metering

What are being metered?

In StratosLive following are being metered tenant-wise.

  • Webapp bandwidth – When a request is coming to a webapp hosted by a tenant and a response is sent, the amount of bandwidth consumed is metered.

  • Service bandwidth – When a service hosted by a tenant is invoked and a response is received, the amount of bandwidth consumed is metered.

  • Registry bandwidth – When registry resources are accessed (get/put), the amount of bandwidth consumed is metered.

  • Registry storage – When artifacts are added to the registry, the amount of consumed registry storage is metered.


How they are being metered?

Webapp and service bandwidths are measured via Tomcat valves(add a link here). When the request is going through the valve, bandwidth is measured. Registry bandwidth and registry storage is measured when artifacts put/get into/from the registry.

StratosLive services (i.e. Enterprise Service Bus, Application Server) measures the above data and sends them to the Business Activity Monitor to be stored. These metered data are then summarized periodically making them available for billing and throttling components.

What data is available for tenants?

Tenants can view their monthly usage report in StratosLive Manager under the following menu.

Home → Billing & Metering → Usage Report

Shown below is a screen shot of a usage report

Throttling

Throttling component is scheduled to run throttling rules periodically and update permission of tenants on accessing/consuming various resources and stores them in the registry. There are throttling agents in each and every service. When a tenant is trying to access a webapp/service/registry item, throttling agent looks for the permission for the relevant action and decides whether to allow or discard the request. One great advantage of the throttling in StratosLive is throttling rules can be updated on the fly. StratosLive Manager provides this facility only to the super-tenant (i.e. the administrator of StratosLive). This means, if you have a private cloud setup, you have total control over throttling. Once the rules are updated via the StratosLive Manager UI, next run of the rules will be using the updated rules.


Billing

Billing (bill generation) is done on a monthly basis. Bill generation is scheduled on the last day of each month. This date can be configured as you wish. When the bill generation is completed, customers (tenants) are informed via email. They can view their invoice in StratosLive Manager Home → Billing & Metering → Past Invoices. Customers can also view their interim invoice too. Interim invoice is the invoice for the time period from last invoice to this moment. This is generated on demand and can be viewed in StratosLive Manager Home → Billing & Metering → Interim Invoice. Shown below is a sample invoice of a tenant.


Where does Billing, Metering & Throttling takes place in StratosLive?

StratosLive user base is growing day-by-day. Therefore, metering, throttling and billing operations can be very heavy. StratosLive deployment architecture makes sure that this does not affect the smooth functioning of any other services. It is done by keeping a dedicated instance for these three heavy tasks. This instance is called the Summarizer.


Monday, August 15, 2011

StratosLive - The most complete open PaaS from WSO2

StratosLive is the new, complete, open PaaS (Platform-as-a-Service) from WSO2. It is powered by WSO2 Stratos which is a cloud middleware platform. WSO2 Stratos shares a common code base with WSO2 Carbon which is a middleware platform.

StratosLive was released on 18th of July 2011(Before that WSO2 had the Stratos beta which reached its EOL with the release of StratosLive). It is a public cloud deployment where you can create your account(tenant) and try it yourself. An important fact about StratosLive is you can try it for free. All you have to do is create an account with a "Demo" usage plan (Demo is for free). If you are interested and if you wanna make use of StratosLive more, you can upgrade your account to be eligible to use more resources such as bandwidth and storage capacity. You can select from SMB, Professional and Enterprise plans. More info about StratosLive usage plans can be found from Pricing Info

If you are familiar with WSO2 Carbon platform or if you want to try out WSO2 Carbon platform, StratosLive gives you that opportunity. Other than the features you find in WSO2 Carbon products, following are some of the new features you can find in StratosLive.

  • Tenant-specific logging - You can view logs related to your tenants activities
  • Monthly invoice and payment via Paypal - You will receive an invoice at the end of the month for using StratosLive. Dont worry, if you are using the Demo plan, you will not be charged a cent. If you are subscribed to other plans such as SMB, Professional or Enterprise, you will get an invoice. StratosLive allows you to pay the invoice via Paypal securely.
  • Usage meter - You can view your usage amounts of StratosLive.
  • You can login to StratosLive using your Google Apps account
Most importantly, StratosLive is a multi-tenant environament (yes, it is tenant aware).
So, go to Stratoslive, try it for free, if you are inspired (I'm sure you will), use it in your production :)

I will blog more about StratosLive soon.

Monday, February 14, 2011

Interesting, but unsolved error when building Apache Axiom

These days I was busy with getting the WSO2 Carbon trunk building successfully. While working on it, I encountered an interesting build failure when building Apache Axiom with tests.

Lets think, the Carbon trunk's structure is as follows.


Carbon
|--Dir1
|--Axiom
|--dirX
|--dirY
|--Dir2
|--Dir3

If I go to the Axiom folder and build it with tests, it builds successfully. But, if I stay in Dir1 (i.e. the parent directory which Axiom is in) and give the maven command to build all modules in Dir1 (with tests), I get this error. This seems to happen when building the Axiom OSGI Test Suite.


-------------------------------------------------------
T E S T S
-------------------------------------------------------
The current artifact axiom-osgi-run-1.2.12-SNAPSHOT.jar is not a valid bundle
Running org.apache.axiom.test.ServiceTest
Tests run: 2, Failures: 0, Errors: 0, Time elapsed: 0 sec
[FATAL ERROR] org.apache.felix.ipojo.junit4osgi.plugin.Junit4osgiPlugin#execute() caused a linkage error (java.lang.LinkageError) and may be out-of-date. Check the realms:
[FATAL ERROR] Plugin realm = app0.child-container[org.apache.felix:maven-junit4osgi-plugin:1.0.0]
urls[0] = file:/home/amila/.m2/repository/org/apache/felix/maven-junit4osgi-plugin/1.0.0/maven-junit4osgi-plugin-1.0.0.jar
urls[1] = file:/home/amila/.m2/repository/junit/junit/3.8.1/junit-3.8.1.jar
urls[2] = file:/home/amila/.m2/repository/org/apache/felix/org.apache.felix.framework/1.6.1/org.apache.felix.framework-1.6.1.jar
urls[3] = file:/home/amila/.m2/repository/org/apache/felix/org.osgi.core/1.2.0/org.osgi.core-1.2.0.jar
urls[4] = file:/home/amila/.m2/repository/org/apache/felix/org.osgi.compendium/1.2.0/org.osgi.compendium-1.2.0.jar
urls[5] = file:/home/amila/.m2/repository/org/apache/felix/org.osgi.foundation/1.2.0/org.osgi.foundation-1.2.0.jar
urls[6] = file:/home/amila/.m2/repository/org/codehaus/plexus/plexus-utils/1.1/plexus-utils-1.1.jar
urls[7] = file:/home/amila/.m2/repository/org/apache/felix/org.apache.felix.ipojo/1.2.0/org.apache.felix.ipojo-1.2.0.jar
urls[8] = file:/home/amila/.m2/repository/org/apache/felix/org.apache.felix.ipojo.metadata/1.2.0/org.apache.felix.ipojo.metadata-1.2.0.jar
urls[9] = file:/home/amila/.m2/repository/org/apache/felix/org.apache.felix.ipojo.handler.extender/1.2.0/org.apache.felix.ipojo.handler.extender-1.2.0.jar
urls[10] = file:/home/amila/.m2/repository/org/apache/felix/org.apache.felix.ipojo.junit4osgi/1.0.0/org.apache.felix.ipojo.junit4osgi-1.0.0.jar
urls[11] = file:/home/amila/.m2/repository/net/sourceforge/cobertura/cobertura/1.9/cobertura-1.9.jar
urls[12] = file:/home/amila/.m2/repository/oro/oro/2.0.8/oro-2.0.8.jar
urls[13] = file:/home/amila/.m2/repository/asm/asm/2.2.1/asm-2.2.1.jar
urls[14] = file:/home/amila/.m2/repository/asm/asm-tree/2.2.1/asm-tree-2.2.1.jar
urls[15] = file:/home/amila/.m2/repository/log4j/log4j/1.2.9/log4j-1.2.9.jar
urls[16] = file:/home/amila/.m2/repository/org/apache/ant/ant/1.7.0/ant-1.7.0.jar
urls[17] = file:/home/amila/.m2/repository/org/apache/ant/ant-launcher/1.7.0/ant-launcher-1.7.0.jar
urls[18] = http://felix.extensions:9/
[FATAL ERROR] Container realm = plexus.core
urls[0] = file:/media/dev/software/apache-maven-2.1.0/lib/maven-2.1.0-uber.jar
urls[1] = file:/home/amila/.m2/repository/org/apache/maven/archetype/archetype-packaging/2.0-alpha-4/archetype-packaging-2.0-alpha-4.jar
urls[2] = file:/home/amila/.m2/repository/org/codehaus/plexus/plexus-utils/1.1/plexus-utils-1.1.jar
[INFO] ------------------------------------------------------------------------
[ERROR] FATAL ERROR
[INFO] ------------------------------------------------------------------------
[INFO] loader constraint violation: loader (instance of org/codehaus/classworlds/RealmClassLoader) previously initiated loading for a different type with name "org/codehaus/plexus/util/xml/XMLWriter"
[INFO] ------------------------------------------------------------------------
[INFO] Trace
java.lang.LinkageError: loader constraint violation: loader (instance of org/codehaus/classworlds/RealmClassLoader) previously initiated loading for a different type with name "org/codehaus/plexus/util/xml/XMLWriter"
at java.lang.ClassLoader.defineClass1(Native Method)
at java.lang.ClassLoader.defineClassCond(ClassLoader.java:632)
at java.lang.ClassLoader.defineClass(ClassLoader.java:616)
at java.security.SecureClassLoader.defineClass(SecureClassLoader.java:141)
at java.net.URLClassLoader.defineClass(URLClassLoader.java:283)
at java.net.URLClassLoader.access$000(URLClassLoader.java:58)
at java.net.URLClassLoader$1.run(URLClassLoader.java:197)
at java.security.AccessController.doPrivileged(Native Method)
at java.net.URLClassLoader.findClass(URLClassLoader.java:190)
at java.lang.ClassLoader.loadClass(ClassLoader.java:307)
at org.codehaus.classworlds.RealmClassLoader.loadClassDirect(RealmClassLoader.java:195)
at org.codehaus.classworlds.DefaultClassRealm.loadClass(DefaultClassRealm.java:255)
at org.codehaus.classworlds.RealmClassLoader.loadClass(RealmClassLoader.java:214)
at java.lang.ClassLoader.loadClass(ClassLoader.java:248)
at org.apache.felix.ipojo.junit4osgi.plugin.XMLReport.generateReport(XMLReport.java:194)
at org.apache.felix.ipojo.junit4osgi.plugin.Junit4osgiPlugin.executeTest(Junit4osgiPlugin.java:573)
at org.apache.felix.ipojo.junit4osgi.plugin.Junit4osgiPlugin.invokeRun(Junit4osgiPlugin.java:447)
at org.apache.felix.ipojo.junit4osgi.plugin.Junit4osgiPlugin.execute(Junit4osgiPlugin.java:253)
at org.apache.maven.plugin.DefaultPluginManager.executeMojo(DefaultPluginManager.java:483)
at org.apache.maven.lifecycle.DefaultLifecycleExecutor.executeGoals(DefaultLifecycleExecutor.java:678)
at org.apache.maven.lifecycle.DefaultLifecycleExecutor.executeGoalWithLifecycle(DefaultLifecycleExecutor.java:540)
at org.apache.maven.lifecycle.DefaultLifecycleExecutor.executeGoal(DefaultLifecycleExecutor.java:519)
at org.apache.maven.lifecycle.DefaultLifecycleExecutor.executeGoalAndHandleFailures(DefaultLifecycleExecutor.java:371)
at org.apache.maven.lifecycle.DefaultLifecycleExecutor.executeTaskSegments(DefaultLifecycleExecutor.java:332)
at org.apache.maven.lifecycle.DefaultLifecycleExecutor.execute(DefaultLifecycleExecutor.java:181)
at org.apache.maven.DefaultMaven.doExecute(DefaultMaven.java:356)
at org.apache.maven.DefaultMaven.execute(DefaultMaven.java:137)
at org.apache.maven.cli.MavenCli.main(MavenCli.java:356)
at sun.reflect.NativeMethodAccessorImpl.invoke0(Native Method)
at sun.reflect.NativeMethodAccessorImpl.invoke(NativeMethodAccessorImpl.java:39)
at sun.reflect.DelegatingMethodAccessorImpl.invoke(DelegatingMethodAccessorImpl.java:25)
at java.lang.reflect.Method.invoke(Method.java:597)
at org.codehaus.classworlds.Launcher.launchEnhanced(Launcher.java:315)
at org.codehaus.classworlds.Launcher.launch(Launcher.java:255)
at org.codehaus.classworlds.Launcher.mainWithExitCode(Launcher.java:430)
at org.codehaus.classworlds.Launcher.main(Launcher.java:375)
[INFO] ------------------------------------------------------------------------
[INFO] Total time: 2 minutes 7 seconds
[INFO] Finished at: Sat Feb 12 23:44:07 IST 2011
[INFO] Final Memory: 233M/964M


Several other people have encountered this problem, but I didn't see a solution for this. If you know the reason for this, please add a comment. It will be very helpful :).

Thursday, February 3, 2011

Monitoring your Java application with JMX - Part 2

In the Part-1 of this article I explained the fundamentals of JMX monitoring, local and remote monitoring and provided an example on monitoring a java application locally. In Part-2 I'll explain how to monitor it remotely and how to authenticate the monitoring process.

Following system properties need to be present for remote monitoring.
-Dcom.sun.management.jmxremote
-Dcom.sun.management.jmxremote.port=portNum where portNum is the port which you want to enable the JMX connection.

You also need to add the follwing two properties.
-Dcom.sun.management.jmxremote.ssl=false
-Dcom.sun.management.jmxremote.authenticate=false

By default, ssl and authentication is enabled. Therefore if you do not set authenticate=false, application will look for a password file and hence fail to start. If ssl is not set to false, you wont be able to connect without configuring ssl properly.

There is a special scenario where your network interface might be only listening to IPv6 addresses and hence a request from an IPv4 address failing to connect. To get rid of this, you have to add the following property too.
-Djava.rmi.server.hostname=yourIP

Lets try to monitor Tcpmon remotely. When we were monitoring Tcpmon locally we just had to start it and monitor. But in remote scenario, we have to provide the parameters mentioned above. To do this, open TCPMON_HOME/build/tcpmon.sh. It will contain,
java -cp ./tcpmon-1.0.jar org.apache.ws.commons.tcpmon.TCPMon $*

Now, edit it by adding the above parameters. Then it will look like,
java -Dcom.sun.management.jmxremote -Dcom.sun.management.jmxremote.port=port
-Djava.rmi.server.hostname=yourIP -Dcom.sun.management.jmxremote.authenticate=false
-Dcom.sun.management.jmxremote.ssl=false -cp ./tcpmon-1.0.jar org.apache.ws.commons.tcpmon.TCPMon $*

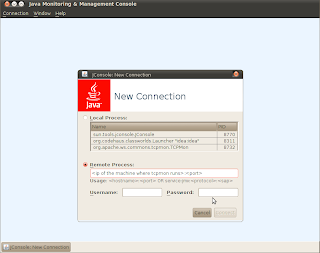
Save tcpmon.sh and run it. You will be successfully able to start Tcpmon. Then start a JConsole from a remote machine. Provide host:port for the remote process and click connect. You will be able to connect to JMX service successfully.

Lets turn to authenticating the monitoring. First, you have to set -Dcom.sun.management.jmxremote.authenticate=true. When this is set, system will be looking for a password file and an access file. You can find these two files (jmxremote.access and jmxremote.password.template) in JDK_HOME/jre/lib/management folder. Copy these two files to a place you refer. Rename jmxremote.password.template to jmxremote.password.

Following is a section extracted from the password file.
# Following are two commented-out entries.  The "monitorRole" role has
# password "QED". The "controlRole" role has password "R&D".
#
monitorRole QED
controlRole R&D

You can define role names (usernames) and passwords as shown above. Actions which are allowed to these roles are defined in the jmxremote.access file. Shown below is a section extracted from it.# Default access control entries:
# o The "monitorRole" role has readonly access.
# o The "controlRole" role has readwrite access and can create the standard
# Timer and Monitor MBeans defined by the JMX API.

monitorRole readonly
controlRole readwrite

You have to restrict access (make read-write-only by the owner) to the jmxremote.password file by,
chmod 0600 jmxremote.password
Then if you ls -l the files, you should see,
-rw-r--r-- 1 amila amila 3896 2011-01-17 17:45 jmxremote.access
-rw------- 1 amila amila 2854 2011-01-17 17:47 jmxremote.password
After that you have to set the system properties to point to the password and access files. Following are the properties.
-Dcom.sun.management.jmxremote.password.file=/path/to/jmxremote.password/file
-Dcom.sun.management.jmxremote.access.file=/path/to/jmxremote.access/file

Lets turn back to our Tcpmon monitoring again. Add the above two properties to tcpmon.sh and make authenticate=true. Then. tcpmon.sh should look like,
java -Dcom.sun.management.jmxremote -Dcom.sun.management.jmxremote.port=port
-Djava.rmi.server.hostname=yourIP -Dcom.sun.management.jmxremote.authenticate=true
-Dcom.sun.management.jmxremote.ssl=false -Dcom.sun.management.jmxremote.password.file=/path/to/jmxremote.password/file
-Dcom.sun.management.jmxremote.access.file=/path/to/jmxremote.access/file -cp ./tcpmon-1.0.jar org.apache.ws.commons.tcpmon.TCPMon $*
Now, save tcpmon.sh and run it. Start a JConsole from a remote machine. Provide the host:port parameters, username and password and click connect. You will be able to successfully monitor Tcpmon remotely. You can try out the difference between the two access roles defined in the jmxremote.access file.

monitorRole readonly
controlRole readwrite


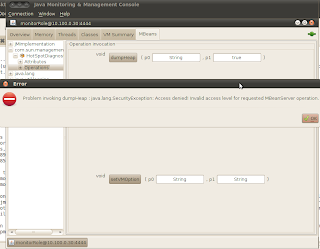
If you log in as the monitorRole, you will be only allowed to monitor. If you try to carry out controlRole tasks, you will be provided with a warning message as shown below.
So, now you are able to monitor your Java application using JMX successfully. For a quick recap, following are the necessary system properties to monitor it remotely.
-Dcom.sun.management.jmxremote
-Dcom.sun.management.jmxremote.port=portNum
-Dcom.sun.management.jmxremote.ssl=false
-Dcom.sun.management.jmxremote.authenticate=true
-Djava.rmi.server.hostname=yourIP
-Dcom.sun.management.jmxremote.password.file=/path/to/jmxremote.password/file
-Dcom.sun.management.jmxremote.access.file=/path/to/jmxremote.access/file
Find more details on JMX from here.

Sunday, January 30, 2011

Monitoring your Java application with JMX - Part 1

What is JMX?
Java Management Extension technology which comes with the Java platform provides a simple and standard way of managing applications and services.You can use JMX technology to monitor the JVM also. It (JVM) has built-in instrumentation which enables you to monitor and manage it.

What we have to do?
To be able to monitor via JMX, you have to set certain system properties when you start the JVM (i.e. When you start your Java application). Following is the syntax of setting a system property.
java -Dpropertyname=value
You can provide these system properties at the commandline or in a configuration file also. Based on your requirement on monitoring, these system properties change. I will explain the necessary properties when the article progresses.

Local and remote monitoring
You can monitor your application/jvm locally or remotely. For remote monitoring to be possible you have to set the follwing properties.
-Dcom.sun.management.jmxremote (if we do not provide a value, default value will be taken. i.e 'true' for htis property).
-Dcom.sun.management.jmxremote.port=portNum where portNum is the port which you want to enable the JMX connection.


Monitoring your java application using JConsole
JConsole is a graphical monitoring tool to monitor jvm/java applications. Executable file for JConsole is located in the JDK_HOME/bin folder. If you have this folder in your system path, you can simply start it by typing jconsole. Else, you will have to provide the absolute path for it. There are two ways to monitor a local application.

1.You can provide the process id of the application when you start JConsole
jconsole processID

2.If you dont provide a process ID, JConsole will list the available local applications for monitoring and you can select from the list.

It is necessary that both JConsole and the Java application started by the same user because JMX uses operating system's file permissions. Local monitoring is not recommended for production environments. The reason for this is, JConsole consumes a considerable amount of resources when running.

For remote monitoring, you either need the jmx service url or the host:port combination. You can provide the host:port combination at JConsole start time or later.
jconsole host:port

Example
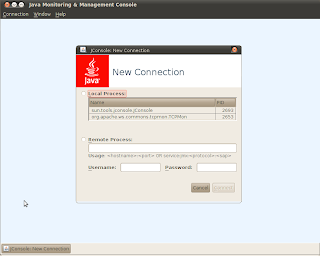
Lets monitor tcpmon, which is a java application using JConsole locally. First, start tcpmon by running tcpmon.sh in TCPMON_HOME/build folder. Then start a JConsole. You will see the available applications to be monitored as shown in the image below.


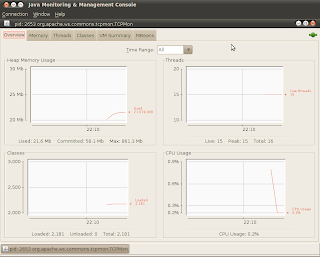
Select tcpmon from the list and click connect. Then you will be connected monitor tcpmon as shown below.


In my next article (i.e. Part 2), I will explain remote monitoring related requirements such as authentication, ssl. There will be an example explaining how to monitor your application remotely.