Java Management Extension technology which comes with the Java platform provides a simple and standard way of managing applications and services.You can use JMX technology to monitor the JVM also. It (JVM) has built-in instrumentation which enables you to monitor and manage it.
What we have to do?
To be able to monitor via JMX, you have to set certain system properties when you start the JVM (i.e. When you start your Java application). Following is the syntax of setting a system property.
java -Dpropertyname=value
You can provide these system properties at the commandline or in a configuration file also. Based on your requirement on monitoring, these system properties change. I will explain the necessary properties when the article progresses.
Local and remote monitoring
You can monitor your application/jvm locally or remotely. For remote monitoring to be possible you have to set the follwing properties.
-Dcom.sun.management.jmxremote (if we do not provide a value, default value will be taken. i.e 'true' for htis property).
-Dcom.sun.management.jmxremote.port=portNum where portNum is the port which you want to enable the JMX connection.
Monitoring your java application using JConsole
JConsole is a graphical monitoring tool to monitor jvm/java applications. Executable file for JConsole is located in the JDK_HOME/bin folder. If you have this folder in your system path, you can simply start it by typing jconsole. Else, you will have to provide the absolute path for it. There are two ways to monitor a local application.
1.You can provide the process id of the application when you start JConsole
jconsole processID
2.If you dont provide a process ID, JConsole will list the available local applications for monitoring and you can select from the list.
It is necessary that both JConsole and the Java application started by the same user because JMX uses operating system's file permissions. Local monitoring is not recommended for production environments. The reason for this is, JConsole consumes a considerable amount of resources when running.
For remote monitoring, you either need the jmx service url or the host:port combination. You can provide the host:port combination at JConsole start time or later.
jconsole host:port
Example
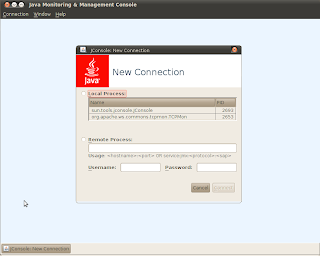
Lets monitor tcpmon, which is a java application using JConsole locally. First, start tcpmon by running tcpmon.sh in TCPMON_HOME/build folder. Then start a JConsole. You will see the available applications to be monitored as shown in the image below.

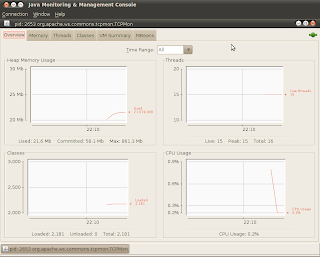
Select tcpmon from the list and click connect. Then you will be connected monitor tcpmon as shown below.

In my next article (i.e. Part 2), I will explain remote monitoring related requirements such as authentication, ssl. There will be an example explaining how to monitor your application remotely.
For JEE servers, there are also some online monitoring tools which leverage JMX (e.g. JBison uses JBoss's jmx-console to read memory usage etc). It's a quick and low-cost way to get some useful monitoring for your app.
ReplyDeleteAdam
Even for web based applications, we can configure monitoring using various open source tools, which are described here.
ReplyDeletehttp://panbhatt.blogspot.com/2011/01/monitoring-your-server-java.html
@Adam: Thanks for the info.
ReplyDelete@panbhatt: yes, I'll include it in another article. Thanks for the link.
Thanks for sharing the information maintain the applications.
ReplyDeleteISO certification providers in india
ISO Certification in Bengaluru
ReplyDeleteISO 9001 Certification in Bengaluru
ISO Certification Consultants in Bengaluru